With timeseries data we often require to resample on different intervel to feed in to our analytics model.
Pandas resample have a built-in list of widely used methods. However, if the built-in methods are not sufficient, it is always possible to write a custom function to resample.
This post shows an example.
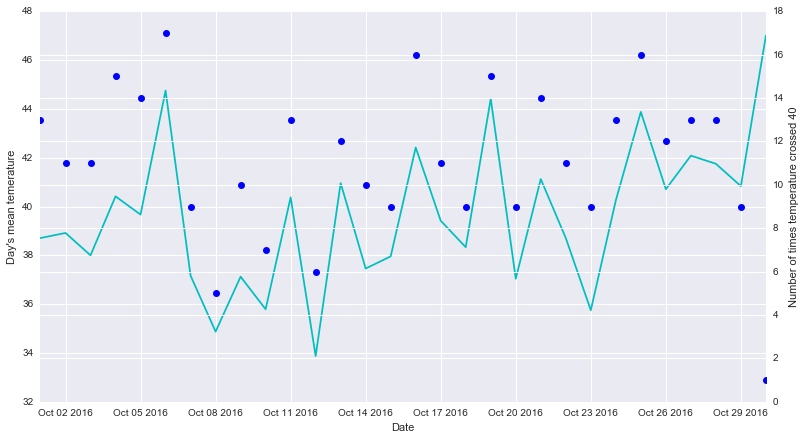
Say, we have a months temperature data captured every hour. We shall calculate the number of times in a day the temperature crossed 40 degree celsius.
import pandas as pd
import numpy as np
import matplotlib.pyplot as plt
import seaborn as sns

ts_index = pd.date_range(start='10/01/2016', end='10/30/2016', freq='H')
temperature_series = pd.Series(np.random.randint(20, 60, len(ts_index)), index=ts_index)

temperature_series_mean = temperature_series
                              .resample('D')
                                  .mean()

temperature_series_gt_40 = temperature_series
                              .resample('D')
                                  .apply(lambda day_array: sum(day_array > 40))

fig, ax1 = plt.subplots()
ax2 = ax1.twinx()

# Day's mean shown as line chart
plt_mean = ax1.plot(temperature_series_mean, 'c-')

# Day's count shown as dot chart
plt_gt40 = ax2.plot(temperature_series_gt_40, 'bo')

ax1.set_xlabel('Date')
ax1.set_ylabel('Day\'s mean temerature')
ax2.set_ylabel('Number of times temperature crossed 40')

plt.legend(handles=plt_mean, loc='upper left')
plt.rcParams['figure.figsize'] = 13,7
plt.show()