Building python visualization of the famous Birthday paradox or Birthday problem.
Birthday problem, is to find the probability of a pair from the given set of randomly chosen people to have same birthday.
Given, we have 365 days (ignoring February 29th). The following chart shows how the probability increases with the number of people.
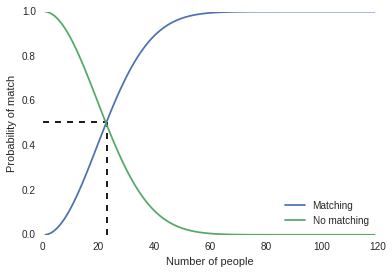
The interesting observation is that, with only 23 people we already have 50% probability to have same birthday. It reaches 99.9% with just 70 people.
Python code used for constructing the visualization
import math
from decimal import Decimal
import matplotlib.pyplot as plt
import seaborn as sns

# Function to find the probability
def sameday_prob(n):
    pBar = Decimal(math.factorial(365))/(pow(365, n) * math.factorial(365 - n))
    return 1 - pBar

# Number of peoples
x = range(1, 120)

# find probabilities for each set of people
y = []
yBar = []
for persons in x:
    prob = sameday_prob(persons)
    y.append(prob)
    yBar.append(1 - prob)

# Plot the chart
line1, = plt.plot(x, y, label="Matching")
line2, = plt.plot(x, yBar, label="No matching")
plt.vlines(23, 0, sameday_prob(23), linestyles=u'dashed')
plt.hlines(sameday_prob(23), 0, 23, linestyles=u'dashed')
plt.legend(handles=[line1, line2], loc=4)
plt.xlabel('Number of people')
plt.ylabel('Probability of match')
The calculation used to find the probability is
$$\bar P(n) = \frac{365!}{365^n (365 - n)!}$$ $$P(n) = 1 - \bar P(n)$$